Hello there map lovers!
I hope you also like nature too, as we are surrounded by some wonderful sights here in Florida. If you're wondering where to go to make the most of our beautiful part of the world, check out this handy guide to the state parks of Florida.
Just click on the map for the area you are interested in, and it will take you through to a section where you can view all the parks within it. You might be surprised at quite how many there are.
Happing traveling. Oh, and if you go into a state park, don't forget to take a map with you!
Click here for the Florida state park guide.
Friday, 28 November 2008

Wednesday, 26 November 2008
Rocking all over the word
It had to happen – but who would have thought it would come from Germany? Yes, we have the first Google Map influenced novel, written by debut writer Christoph Benda.
Benda's work, Senghor on the Rocks, is a geo-referenced electronic novel in which the text is combined with an embedded map mash-up from Google Maps on a website.
The map, viewed in the satellite mode, moves as the location changes in the novel and every page of text is accompanied by a corresponding map. The geo-novel is an adaption of a book written by Benda, a former advertising copywriter now working at the Austrian Academy of Sciences, and is based on his travels in Senegal.
"For me, the project always has been related to a map in a certain sense. Only that it wasn't hi-tech, online satellite imagery but the rather worn out paper map I had carried with me throughout all my time in Africa," says Benda who wrote the book between 2002 and 2005.
"It's a fast paced adventure that starts as a job, develops into an involuntary journey and culminates in a reflection about the possibilities and limits of cross-cultural understanding," explains Florian Ledermann, a software engineer at the Vienna University of Technology, who worked with Benda on the project.
As yet the work is only available in German, bu with the launch this year by Amazon of the internet-connected Kindle electronic book reader, it may not be too long before even more geo-referenced publications hit the mainstream.
Benda's work, Senghor on the Rocks, is a geo-referenced electronic novel in which the text is combined with an embedded map mash-up from Google Maps on a website.
The map, viewed in the satellite mode, moves as the location changes in the novel and every page of text is accompanied by a corresponding map. The geo-novel is an adaption of a book written by Benda, a former advertising copywriter now working at the Austrian Academy of Sciences, and is based on his travels in Senegal.
"For me, the project always has been related to a map in a certain sense. Only that it wasn't hi-tech, online satellite imagery but the rather worn out paper map I had carried with me throughout all my time in Africa," says Benda who wrote the book between 2002 and 2005.
"It's a fast paced adventure that starts as a job, develops into an involuntary journey and culminates in a reflection about the possibilities and limits of cross-cultural understanding," explains Florian Ledermann, a software engineer at the Vienna University of Technology, who worked with Benda on the project.
As yet the work is only available in German, bu with the launch this year by Amazon of the internet-connected Kindle electronic book reader, it may not be too long before even more geo-referenced publications hit the mainstream.
Monday, 24 November 2008
The Sunshine State

Hello there map lovers!
Ever wonder why so many people choose to visit Florida each year? Yes we have some great beaches, lively towns and cities, a friendly outlook on life and some of the best fishing and golf on the planet. But as well as all that, they come for our wonderful, stable and reliable climate.
There is a very good reason why we're called the Sunshine State - we have so much of the stuff year-round there is nothing else to say. While no one would claim that Florida is anything like a desert, we certainly receive less than our share of rainfall, which you can see from this average rainfall chart.
Here's the link if you want to see it slightly bigger.
As you can see, the central areas get the least rainfall (as indicated by the amber-gold areas) while as you move up to the panhandle, the rainfall (represented by blue shading) increases. Also note the higher levels of rainfall at the south-eastern tip of Florida, which catches the gulf stream. From those of us who live on the gulf coast side, thanks Miami and the Keys for taking the hit - we're most grateful!
Visit annamaria.com for more reasons to visit Florida's wonderful gulf coast.
Thursday, 20 November 2008
A view from above
 Hello map fans! Here's another look at Florida from space. This one is from the South Florida Water Management District. If you follow the link you can click on any area of the map for a closer look. It's interesting when you look down on a large area of Earth, don't you find you learn things you never knew before? See what you can discover by following this link
There are loads of great maps on my website, if you think I have left any off please do contact me and I will add as many as I can.
Tuesday, 18 November 2008
Smoke and mirrors
Hello map lovers!
You will already be familiar with NASA satellite images, the sight of the Earth from space is a common one. The agency does more than just fly shuttle runs past our atmosphere and back as the series of pictures tracking the Southern California wildfires illustrate. The images were taken with one of NASA's research satellites and offer a truly remarkable view of the course of the fires.
Click here to see pictures of the plume of smoke billowing out over the Pacific Ocean on NASA's website like the one below.
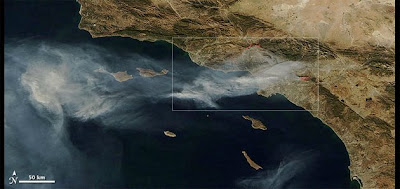 (Credit: Nasa)
You will already be familiar with NASA satellite images, the sight of the Earth from space is a common one. The agency does more than just fly shuttle runs past our atmosphere and back as the series of pictures tracking the Southern California wildfires illustrate. The images were taken with one of NASA's research satellites and offer a truly remarkable view of the course of the fires.
Click here to see pictures of the plume of smoke billowing out over the Pacific Ocean on NASA's website like the one below.
 (Credit: Nasa)
Delcan McCullagh, writing on Cnet, adds: 'The images show smoke from the fires being blown west over the Pacific Ocean from a portion of the state stretching from Santa Barbara to Riverside County. They were taken with the Moderate Resolution Imaging Spectroradiometer, which specializes in measurements including cloud cover, ocean color, and water vapor, and has delivered pictures of notable events including Hurricane Katrina and Bangladesh flooding in the past.'
Declan advises another way to view the effects of the fires is to check out the Google Earth maps of the area. Available maps include a detailed outline of the area, homes affected, official warnings, and evacuation orders.
Monday, 17 November 2008
Whatever the weather
Hello there map lovers, I wonder if you've ever heard of the National Oceanic and Atmospheric Administration (NOAA) National Data Buoy Center (NDBC), a part of the National Weather Service (NWS).
NDBC designs, develops, operates, and maintains a network of data collecting buoys and coastal stations positioned around our coast.
This from the NDBC website: NWS forecasters need frequent, high-quality marine observations to examine conditions for forecast preparation and to verify their forecasts after they are produced. Other users rely on the observations and forecasts for commercial and recreational activities. NDBC provides hourly observations from a network of about 90 buoys and 60 Coastal Marine Automated Network (C-MAN) stations to help meet these needs. All stations measure wind speed, direction, and gust; barometric pressure; and air temperature. In addition, all buoy stations, and some C-MAN stations, measure sea surface temperature and wave height and period. Conductivity and water current are measured at selected stations.
To support this network and other engineering/data collection projects, NDBC employs engineers, meteorologists, oceanographers, computer scientists, and other professionals. U.S. Coast Guard (USCG) members serve on the government staff to provide unique skills and interface with USCG for transportation support. An NDBC Technical Services Contractor (NTSC) supports NDBC with a staff of approximately 110 employees.
You can view a clickable map of Florida, showing all the buoy stations here. This is what it will look like
NDBC designs, develops, operates, and maintains a network of data collecting buoys and coastal stations positioned around our coast.
This from the NDBC website: NWS forecasters need frequent, high-quality marine observations to examine conditions for forecast preparation and to verify their forecasts after they are produced. Other users rely on the observations and forecasts for commercial and recreational activities. NDBC provides hourly observations from a network of about 90 buoys and 60 Coastal Marine Automated Network (C-MAN) stations to help meet these needs. All stations measure wind speed, direction, and gust; barometric pressure; and air temperature. In addition, all buoy stations, and some C-MAN stations, measure sea surface temperature and wave height and period. Conductivity and water current are measured at selected stations.
To support this network and other engineering/data collection projects, NDBC employs engineers, meteorologists, oceanographers, computer scientists, and other professionals. U.S. Coast Guard (USCG) members serve on the government staff to provide unique skills and interface with USCG for transportation support. An NDBC Technical Services Contractor (NTSC) supports NDBC with a staff of approximately 110 employees.
You can view a clickable map of Florida, showing all the buoy stations here. This is what it will look like

From the stations you will be able to get detailed weather information - what you are supposed to do with this information and whether you can do anything about it is another matter entirely!
Friday, 14 November 2008
FEMA updates disaster maps
The Federal Emergency Management Agency just updated flood maps in many southeast states, including Florida. FEMA not only changed the maps, but presented the maps online. The organization said the new maps are more accurate, easier to update and are being used by mortgage companies to base loans. The changes will require some homeowners who have never had to carry flood insurance to purchase policies. Others who used to be forced to carry flood insurance policies will be able to drop them if their property is no longer in a flood zone. Flood insurance rates differ from state to state but can cost about $700 to $800 a year. The best way to find out if a resident is in a flood-susceptible zone is to contact an insurance agent. For an interactive map of where you live, such as the Florida one below, click here. It lets you determine the flood and disaster risk of your home town, city or area - from Seattle to Key West - although some areas are more susciptible to such risks than others...


Subscribe to:
Posts (Atom)

